When you purchase through links on our site, we may earn a commission at no extra cost to you. Learn more.

It’s no secret that we’re crazy about our pets. We write about every dog-related subject we can get our paws on, so we thought it would be fun to research pet ownership statistics and share them with you.
Table of Contents
We give you verified pet ownership statistics concerning the location, cost, and demographics of pet parents.
How Many Dogs Are In The World?
Unfortunately, this question is impossible to answer. Many countries have no registration process for animals. Not to mention, the number of strays that populate the streets is unknown. It is estimated by the World Animal Foundation that there are around 900 million dogs in the world. This includes pets and free-roaming animals.
What we can share is that there are an estimated 900 million dogs and 600 million cats worldwide.
In 2022, there were an estimated 104 million pet dogs in Europe.1 And in 2022, there were an estimated 51.2 million pet dogs in China.2 Currently, Brazil has the highest number of small dogs per capita worldwide.
How does the United States compare to these other countries? In 2024, there were 89.7 million pet dogs in the U.S.3
How Many U.S. Households Own A Pet?
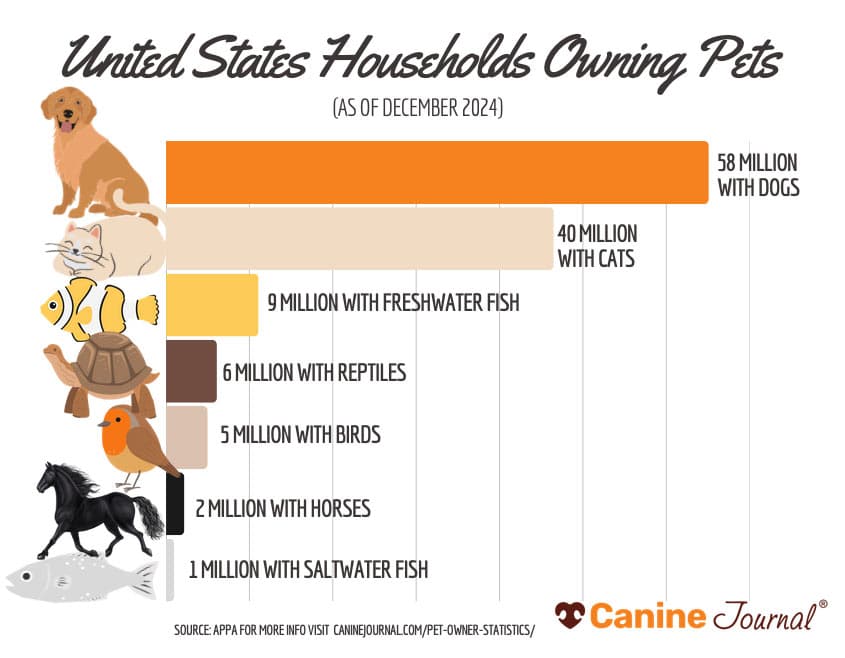
Americans are fond of having furry (or scaly or feathery) pets in their homes. According to the 2024 APPA National Pet Owners Survey, about 82 million U.S. households own a pet. Dogs were by far the most common pets, with 58 million homes owning a dog, followed closely by cats with 40 million homes. Other common pets in U.S. households include freshwater fish, birds, small animals, reptiles, horses, and saltwater fish.4
Fun Fact
With dogs being the most popular pets for Americans, Labrador Retrievers were the most popular breed in the U.S. for 31 years in a row5, but in 2022, the French Bulldog took over the number one spot.
Pet Ownership Statistics By State
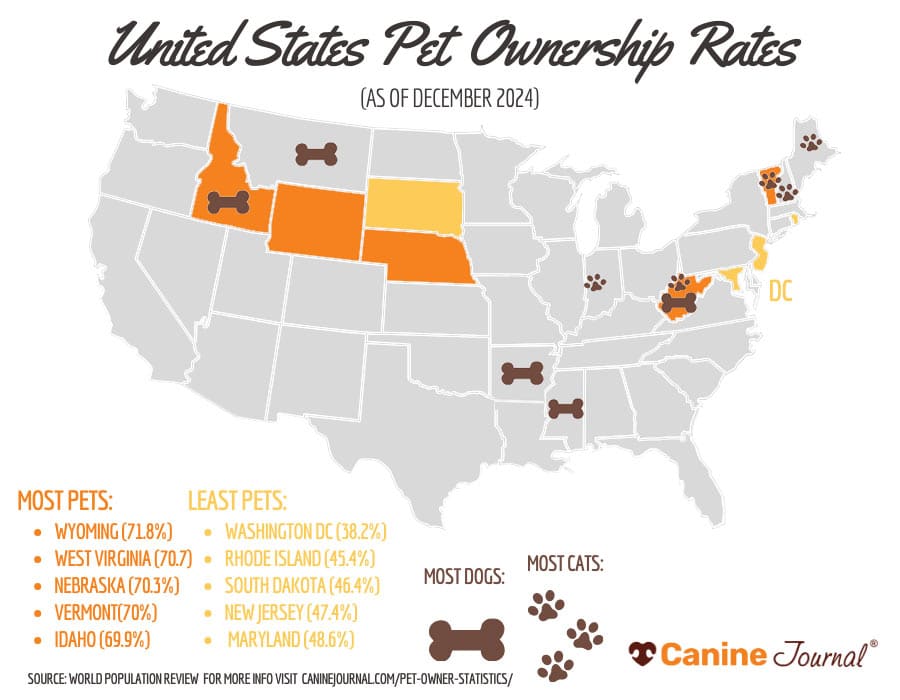
Rural areas tend to have higher percentages of pet ownership than urban areas. As of November 2024, data shows that Wyoming has the highest rate of pet ownership at 71.8%, followed by West Virginia (70.7%), Nebraska (70.3%), Vermont (70%), and Idaho (69.9%). States with the lowest rate of pet ownership include Rhode Island (45.4%), South Dakota (46.4%), New Jersey (47.4%), and Maryland (48.6%). The District of Columbia has the lowest pet ownership rate (38.2%).6
Which States Have More Dogs vs Cats?
Wondering which places you are most likely to see cats or dogs?6
Most Dog Ownership:
- Idaho (58.3%)
- Montana (51.9%)
- Arkansas (51.6%)
- Mississippi (51%)
- West Virginia (49.6%)
Most Cat Ownership:
- Vermont (44.6%)
- Maine (43.6%)
- West Virginia (37.7%)
- Indiana (37.5%)
- New Hampshire (36.4%)
How Much Do Americans Spend On Pets?
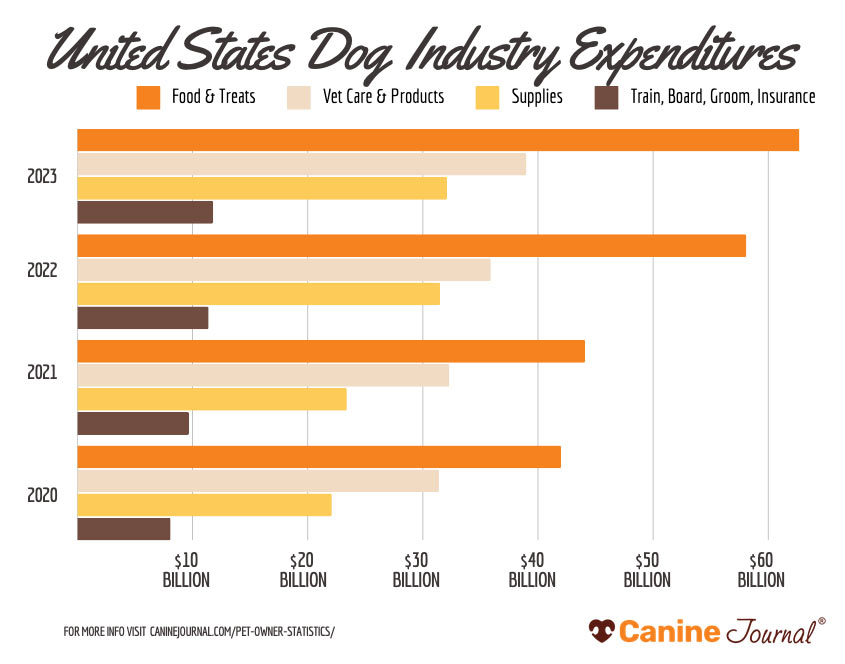
We love our pets dearly and want them to have the comfiest bed, healthiest food, yummiest treats, the best pet insurance, and the most fun toys. But there are also necessities that our pets need, like vet care, grooming, and medication. In 2024, U.S. pet industry expenditures totaled $150.6 billion. That’s an increase from $147 billion in 2023 and $136.8 billion in 2022.4
Dog Expenditures In 2023:
- Pet food and treats: $64.4 billion
- Supplies, live animals & OTC medicine: $32 billion
- Vet care and product sales: $38.3 billion
- Boarding, grooming, insurance, training, sitting, walking: $12.3 billion
Estimated Dog Expenditures For 2024:
- Pet food and treats: $66.9 billion
- Supplies, live animals & OTC medicine: $32 billion
- Vet care and product sales: $39.1 billion
- Boarding, grooming, insurance, training, sitting, walking: $12.6 billion
The average annual expense for dog parents was $1,740 in 2024 (down from $1,852 in 2023), and $1,311 in 2024 for cat parents (up from $1,235 in 2023).7 Of course, this is simply an estimate of basic costs. Cat and dog owners often spend far more on high-quality food, treats, and toys. Older dogs and cats may need more medical care, on average $200 to $500 more a year.
Pets with special needs and health concerns often need special diets or medication. Doggy daycare can also be very expensive. Larger dog breeds need bigger supplies, which cost more in the larger sizes.
Basic Annual Dog Expenses:
- Surgical vet visits: $458
- Food: $287
- Kennel boarding: $228
- Routine vet visits: $242
- Treats: $81
- Grooming/Groomer aids: $47
- Vitamins: $81
- Toys: $56
Basic Annual Cat Expenses:
- Food: $254
- Surgical vet visits: $201
- Routine vet visits: $178
- Kennel boarding: $78
- Treats: $72
- Vitamins: $47
- Grooming/Groomer aids: $31
- Toys: $41
Pet Owner Demographics In The U.S.
Here are some quick stats from 2023 about pet parent demographics.8
- Relationship status affects pet ownership:
- 77% of partnered adults have pets
- 65% of married adults have pets
- 55% of people who are divorced, separated, or widowed have pets
- 49% of people who have never been married have pets
- Rural Americans are more likely to own pets and to own more pets:
- 71% of adults in rural areas own pets
- 47% of adults in rural America have more than 1 pet
- 32% of adults in the suburbs have pets
- 26% of urban living Americans have pets
- Households with pets by racial and ethnic type:
- 68% White
- 66% Latino/Hispanic
- 37% Asian
- 34% Black/African-American
Cat Owners vs Dog Owners
Do you know that cat owners differ from dog owners on average? 9
Dog Parents:
- Watch more romcoms, horror, and action films
- 2x as likely to work in finance and tend to earn more money than cat owners
- Enjoy sports, yoga, dancing, and travel
Cat Parents:
- Watch more documentaries, musicals, or indie films
- Are more creative and 4x more likely to work in a creative field than dog owners
- Enjoy reading, writing, and gardening

Pet Insurance Statistics
No matter the country, people love their pets. It doesn’t matter where you live, what your income is, or what your ethnic background is. Pets make this world a better place. If you would like to learn more, we recommend the book Pet Nation by Mark L. Cushing. It provides a deep dive into the history, data, and dynamics that better explain the rapid rise in the popularity of pets in our homes and our economy.
If you enjoy reading about pet statistics, you may like to read our pet insurance statistics. You can learn more about health-related expenses associated with dogs and how pet insurance can help pay for these costly, unexpected vet visits.

Was there a statistic that surprised you? Which one? We’d love to hear your thoughts in the comments.
Sources: [1] FEDIAF for European Pet Food Industry, [2] Statista, [3] AVMA, [4] APPA, [5] AKC, [6] World Population Review, [7] AVMA, [8] Pew Research, [9] Mars Petcare